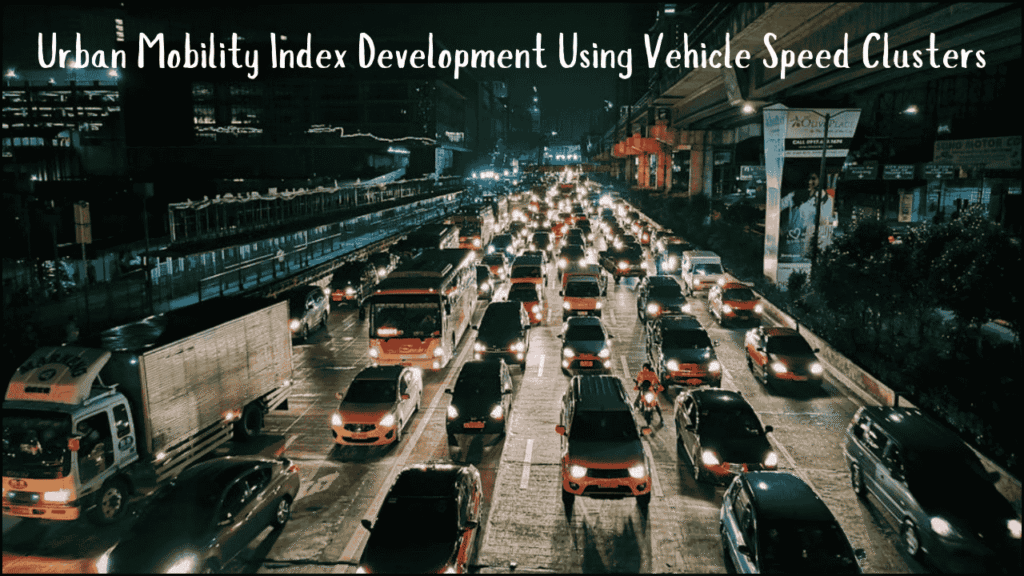
Urban mobility represents one of the most pressing concerns in modern cities as population density, traffic congestion, and transportation inefficiencies continue to affect the quality of life. A systematic measurement of how efficiently people move within cities requires indices that capture both speed and accessibility. Development of an Urban Mobility Index using vehicle speed clusters provides a data-driven framework to assess mobility patterns, evaluate policy effectiveness, and guide infrastructure planning. This approach uses vehicle speed clusters as the foundation to generate quantifiable insights into traffic flow and urban dynamics.
Table of Contents
Importance of an Urban Mobility Index
- Measurement of performance – Urban areas require consistent tools to measure mobility efficiency.
- Benchmarking – Cities can compare mobility across different time periods or against other regions.
- Policy evaluation – Urban planners can test the impact of interventions such as new roads, congestion charges, or public transport initiatives.
- Citizen welfare – A reliable index highlights problem zones where commuters lose significant time, helping direct resources efficiently.
Concept of Vehicle Speed Clusters
- Speed clustering groups vehicles based on their average speeds across road networks.
- Low-speed clusters indicate congestion and bottlenecks.
- Medium-speed clusters represent balanced flows typical of well-managed traffic.
- High-speed clusters occur where road infrastructure is efficient and traffic is light.
- Clustering algorithms like K-means or DBSCAN can classify speed data collected from sensors, GPS devices, or mobile applications.
Framework for Index Development
An Urban Mobility Index (UMI) using vehicle speed clusters requires structured steps:
- Data Collection
- GPS-based tracking from vehicles, ride-hailing services, and mobile apps.
- Roadside sensors and traffic cameras.
- Satellite imagery for macro-level movement.
- Preprocessing and Cleaning
- Removal of outliers such as stationary vehicles.
- Adjustment for unusual events like road closures.
- Clustering Process
- Selection of clustering technique.
- Categorization into low, medium, and high-speed groups.
- Index Construction
- Weighted scores assigned to each cluster.
- Combination into a single value representing overall mobility.
- Validation
- Cross-check with real-world commuter surveys.
- Adjustment for seasonal or temporal variations.
Core Components of the Index
- Average Vehicle Speed – Central factor for traffic efficiency.
- Speed Variability – Reflects stability of travel conditions.
- Congestion Ratio – Percentage of time spent in low-speed clusters.
- Peak vs Off-Peak Difference – Captures rush hour impact.
- Geographic Coverage – Ensures index represents the whole city rather than selective zones.
Comparison of Vehicle Speed Clusters
| Cluster Type | Speed Range (km/h) | Interpretation | Impact on Mobility Index |
|---|---|---|---|
| Low-Speed | 0 – 20 | Severe congestion, stop-and-go traffic | Reduces index value sharply |
| Medium-Speed | 20 – 45 | Balanced movement, moderate traffic | Stabilizes index |
| High-Speed | Above 45 | Free-flowing traffic, efficient roads | Reduces the index value sharply |
Advantages of Speed Cluster-Based UMI
- Data-driven approach eliminates reliance on assumptions.
- Scalability allows applications to run across cities with varying infrastructures.
- Temporal adaptability captures daily, weekly, and seasonal trends.
- Policy relevance enables identification of zones for congestion pricing, infrastructure upgrades, or traffic light optimization.
- Integration potential with public transport performance indicators.
Limitations and Challenges
- Data availability – Not all cities have comprehensive GPS or sensor coverage.
- Privacy concerns – Use of GPS data requires strict anonymity protections.
- Dynamic variations – Road conditions, accidents, and weather may distort short-term data.
- Technology reliance – Index accuracy depends heavily on consistent data quality.
- Comparability issues – Cities with different road designs may need customized benchmarks.
Urban Policy Applications
- Traffic Management
- Identification of chronic congestion hotspots.
- Deployment of adaptive traffic signals.
- Infrastructure Planning
- Prioritization of road widening projects.
- Development of bypass routes.
- Public Transport Enhancement
- Measurement of speed benefits from dedicated bus lanes.
- Integration with the metro and suburban rail expansion.
- Environmental Goals
- Reduction of idle times lowers emissions.
- Encouragement of eco-friendly transport policies.
Example Calculation Structure
| Cluster Contribution | Weight Factor | Cluster Score | Final Weighted Value |
|---|---|---|---|
| Low-Speed Cluster | 0.5 | 20 | 10 |
| Medium-Speed Cluster | 0.3 | 70 | 21 |
| High-Speed Cluster | 0.2 | 90 | 18 |
| Urban Mobility Index | – | – | 49 |
Key Indicators Derived from UMI
- Travel Time Index (TTI) – Ratio of peak to off-peak travel times.
- Congestion Intensity Index (CII) – Proportion of time spent in low-speed clusters.
- Reliability Index (RI) – Standard deviation of travel speeds across different time slots.
- Sustainability Index (SI) – Estimation of emissions reduced with improved traffic flows.
Future Directions
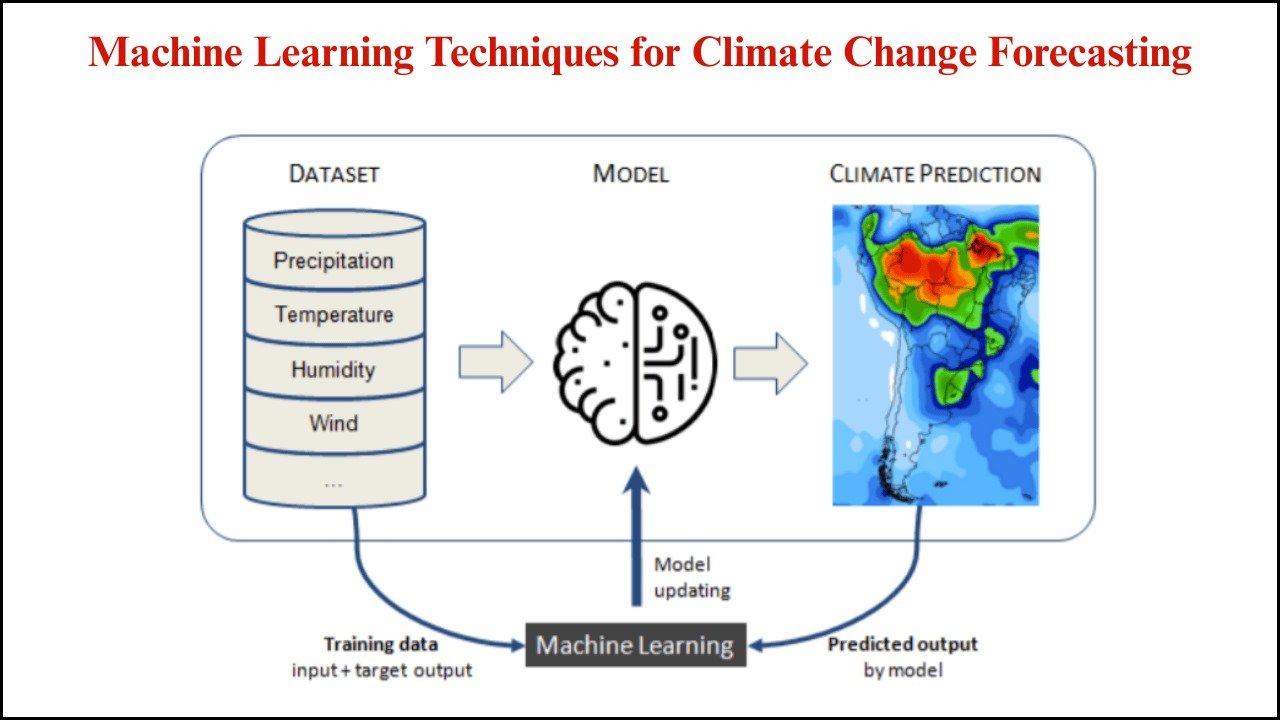
- Integration with AI – Machine learning models to predict congestion before it occurs.
- Smart city applications – Real-time dashboards for city administrators.
- Multi-modal inclusion – Expansion of the index beyond vehicles to cycling, walking, and public transit.
- Dynamic pricing strategies – Using UMI for implementing congestion charges.
- Citizen engagement – Public availability of UMI scores to encourage alternative travel behavior.
Advantages Over Traditional Indices
| Traditional Approach | Cluster-Based UMI |
|---|---|
| Focuses on single variables like average travel time | Considers multiple speed clusters simultaneously |
| Limited adaptability across time zones | Captures peak, off-peak, and seasonal variations |
| Often survey-based with high cost | Sensor-driven, automated, and scalable |
| Lacks predictive capabilities | Can integrate with predictive AI tools |
Case-Based Insights
- City A – Adoption of cluster-based UMI revealed that, despite high average speed in certain highways, the overall index was low due to significant congestion zones in the city center.
- City B – Implementation of bus rapid transit lanes improved medium-speed cluster stability, raising overall UMI score by 15% within a year.
- City C – Data-driven congestion pricing led to the redistribution of peak-hour traffic, reducing the low-speed cluster proportion by 8%.
The Way Forward
Urban mobility index development using vehicle speed clusters creates a more reliable and insightful way to measure traffic efficiency. A data-centric method captures variations across different time zones, road types, and travel conditions. Index values built on clustering provide planners with actionable insights for traffic management, infrastructure investment, and sustainable city planning. As urbanization accelerates, a cluster-based index becomes essential for shaping cities that move people efficiently and reduce environmental burdens.