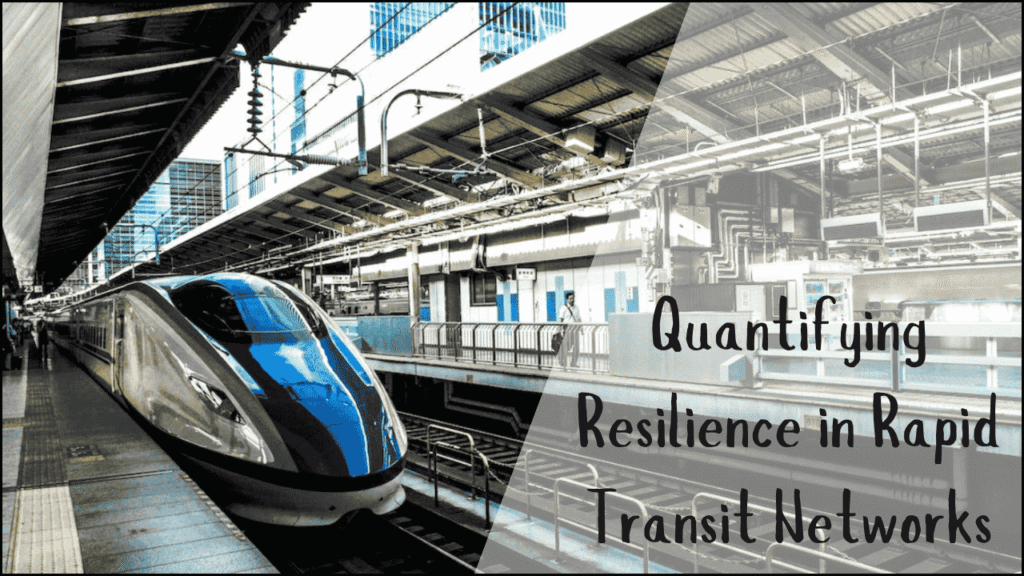
Urban mobility depends heavily on rapid transit systems, which form the backbone of economic and social activities in growing cities. Network resilience defines how well these systems can withstand, adapt, and recover from disruptions such as accidents, equipment failures, cyberattacks, or natural disasters. Quantifying resilience in rapid transit networks allows urban planners, policymakers, and engineers to assess vulnerabilities and design strategies that minimize disruptions for passengers. A structured analysis of resilience offers measurable indicators and actionable solutions that support efficiency, safety, and reliability in public transportation.
Table of Contents
Meaning of Resilience in Rapid Transit Networks
- Resilience in rapid transit networks refers to the ability of a system to maintain functionality during disruptions and recover effectively afterward.
- The concept involves robustness, redundancy, adaptability, and recoverability of network components.
- Resilience differs from reliability; reliability measures performance under normal conditions, while resilience focuses on abnormal or stressful scenarios.
Key Dimensions of Resilience
- Robustness – Strength of network infrastructure against shocks.
- Redundancy – Availability of alternative routes or systems.
- Adaptability – Flexibility to adjust operations during disturbances.
- Recovery – Speed and efficiency of restoring services to normal levels.
- Sustainability – Long-term ability to balance service reliability and resource use.
Why Quantification is Important
- Provides measurable indicators to compare different transit systems.
- Helps prioritize investments in vulnerable parts of the network.
- Supports simulation of various disruption scenarios.
- Assists policymakers in evaluating long-term risk management strategies.
- Strengthens passenger confidence by ensuring transparent service planning.
Methods of Quantifying Resilience
Graph Theory Metrics
- Nodes represent stations and edges represent tracks.
- Connectivity, centrality, and betweenness metrics identify weak points.
Performance-Based Measures
- Passenger delays, travel times, and service coverage are tracked before and after disruptions.
- Recovery curves show how quickly service levels return to normal.
Simulation Models
- Scenarios such as floods, equipment breakdowns, or cyberattacks are modeled.
- Predictive simulations test the resilience of system operations.
Network Efficiency Indices
- Evaluates how efficiently passengers can travel despite disruptions.
- Compares baseline and post-disruption travel costs.
Indicators for Measuring Resilience
| Indicator | Description | Application |
|---|---|---|
| Connectivity Ratio | Percentage of stations connected after the disruption | Identifies critical links |
| Average Path Length | Average travel steps between nodes | Shows passenger detours |
| Passenger Flow Capacity | Number of passengers that can still be moved | Assesses service continuity |
| Recovery Time | Duration to restore full operation | Evaluates disaster preparedness |
| Redundancy Index | Number of alternative routes available | Guides infrastructure design |
| Vulnerability Score | Risk level of individual nodes or edges | Highlights priority areas for protection |
Factors Affecting Resilience
- Infrastructure Quality – Aging tracks, outdated vehicles, or insufficient maintenance reduce robustness.
- Urban Density – High population density puts additional strain on the network.
- Technology Integration – Smart systems enable quicker detection and response.
- Governance and Policy – Effective coordination accelerates recovery measures.
- Financial Resources – Adequate investment supports redundancy and modernization.
Approaches to Improving Resilience
- Designing Redundancy – Adding bypass tracks, loop lines, or parallel services.
- Smart Monitoring – Using sensors, AI, and IoT for early fault detection.
- Passenger-Centric Planning – Providing clear communication and alternative travel options.
- Crisis Management Plans – Training staff for rapid response during disruptions.
- Cross-Network Integration – Linking buses, trams, and metro systems for fallback connectivity.
Case Studies of Resilience Quantification
| City | Method Used | Findings |
|---|---|---|
| London Underground | Graph theory and passenger flow models | Central stations like King’s Cross are identified as critical hubs |
| Tokyo Metro | Simulation-based resilience analysis | Earthquake preparedness improved through redundant loop lines |
| New York City Subway | Recovery time studies after Hurricane Sandy | Highlighted the vulnerability of flood-prone stations |
| Singapore MRT | Data-driven predictive analytics | AI used for preventive maintenance and fault detection |
| Shanghai Metro | Efficiency-based resilience evaluation | Redundancy in interchange stations increased adaptability |
Comparison of Resilience Indicators in Practice
| Aspect | High Resilience Network | Low Resilience Network |
|---|---|---|
| Connectivity | Multiple parallel routes | Single-line dependence |
| Recovery Speed | Hours to restore | Days or weeks |
| Passenger Impact | Minimal delays | Significant service breakdowns |
| Investment in Technology | Advanced monitoring | Outdated infrastructure |
| Crisis Management | Proactive strategies | Reactive responses |
Challenges in Quantifying Resilience
- Data Limitations – Incomplete passenger data or network information.
- Dynamic Nature of Risks – Climate change and new cyber threats evolve rapidly.
- Interdependency – Power supply, IT systems, and road traffic also affect transit resilience.
- Cost Constraints – Investment in redundancy and modernization requires high funding.
- Unpredictability of Human Behavior – Passenger responses during crises impact overall system performance.
Future Directions in Resilience Quantification
- AI and Machine Learning – Predict failures and recommend preventive strategies.
- Digital Twins – Virtual models of entire networks for real-time scenario testing.
- Sustainability Integration – Combining environmental and resilience goals.
- Passenger-Centered Metrics – Measuring psychological resilience and confidence of users.
- Global Benchmarking – Creating standardized indicators across cities for comparative analysis.
Benefits of Strong Resilience Strategies
- Economic Stability – Reduces financial losses during disruptions.
- Passenger Satisfaction – Builds trust and reliability in public transport.
- Operational Efficiency – Ensures continuous movement of people and goods.
- Safety Assurance – Minimizes accidents and hazards.
- Long-Term Sustainability – Promotes energy-efficient and robust infrastructure.
Wrapping Up
Urban transit resilience defines the strength and adaptability of a city’s mobility backbone. Quantifying resilience in rapid transit networks provides planners with clear insights into vulnerabilities, potential risks, and effective strategies for mitigation. The ability to measure and improve resilience ensures that passengers experience reliable, safe, and efficient travel, even during disruptions. Strong resilience frameworks not only protect infrastructure but also support economic stability and passenger confidence, making them essential for sustainable urban development.


